

Azure Kubernetes Chronicles part 3: Observability
Welcome back to the Azure Kubernetes Chronicles! In our previous posts, we explored the basics of Container Network Interfaces (CNIs) and had a first glance at how eBPF is changing networking within Azure Kubernetes Service (AKS). If you haven’t had a chance to read it yet, you might want to catch up here.
In this episode, we’re diving even deeper into the labyrinth of Kubernetes by shining a light on a topic that’s both critical and fascinating: Observability!
· What is Observability?
· eBPF and observability
· Implementation in Azure
· Azure managed Prometheus and Grafana
· What is Cilium Hubble?
· Conclusion
What is Observability?
Observability in cloud-native environments refers to the ability to gain deep insights into the internal state of systems based on external outputs. It extends beyond traditional monitoring by focusing on three core pillars: metrics, logs, and traces. Metrics provide quantitative data on system performance, logs capture detailed event records, and traces map the flow of requests across distributed components. Observability is critical for modern cloud operations because it enables engineers to diagnose issues proactively, optimize performance, and ensure reliability. Unlike traditional monitoring, which relies on predefined thresholds, observability allows teams to explore unknown failure modes by analyzing real-time telemetry data.
eBPF and observability
eBPF (Extended Berkeley Packet Filter) is revolutionizing observability by enabling lightweight and high-performance monitoring directly within the Linux kernel. eBPF allows programs to run in a sandboxed manner within the kernel, collecting granular data about system behaviour without modifying application code. This makes it highly effective for deep observability in Kubernetes environments, as it can track network traffic, system calls, and performance metrics with minimal overhead. With eBPF, cloud engineers can gain insights into issues like latency spikes, security anomalies, and inefficient resource usage in real time, making it a powerful tool for modern observability solutions.
Implementation in Azure
Azure Monitor for containers provides comprehensive logging, metrics, and distributed tracing for AKS workloads, enabling engineers to detect performance bottlenecks and failures efficiently. Prometheus and Grafana can be integrated for custom metrics visualization, while Azure Log Analytics aggregates logs from nodes and applications. Additionally, eBPF-powered solutions like Cilium enhance network observability and security within AKS clusters. By leveraging these tools, cloud architects and engineers can gain full-stack visibility into their Kubernetes environments, ensuring operational excellence in cloud-native applications.
# Create the resource group
az group create --name aks-blog-rg --location swedencentral

# Deploy the cluster
az aks create \
--name aks-blog-cluster \
--resource-group aks-blog-rg \
--location swedencentral \
--tier standard \
--kubernetes-version 1.29 \
--os-sku AzureLinux \
--node-count 3 \
--load-balancer-sku standard \
--network-plugin azure \
--network-plugin-mode overlay \
--network-dataplane cilium \
--network-policy cilium \
--enable-managed-identity \
--enable-azure-monitor-metrics \
--enable-acns \
--generate-ssh-keys

# Get AKS credentials
az aks get-credentials --name aks-blog-cluster --resource-group aks-blog-rg
The script will deploy an Azure Kubernetes Cluster with the following configuration:
-
- Deployed in Sweden Central
- Kubernetes version 1.29
- Azure Linux for the nodes
- Standard Tier
- 3 nodes
- Cilium for dataplane and network policies
- Advanced Container Networking Services Enabled
Azure managed Prometheus and Grafana
Azure offers fully managed services for both Prometheus and Grafana, streamlining observability while reducing operational overhead.
Azure Monitor Managed Service for Prometheus
Azure Monitor Managed Service for Prometheus is a fully managed, scalable implementation of the popular open-source monitoring system, Prometheus. Designed for cloud-scale observability, it integrates seamlessly with Azure Kubernetes Service (AKS) and Azure Arc-enabled Kubernetes clusters, providing high availability, automatic updates, and long-term data retention (up to 18 months). Unlike self-managed Prometheus, this service removes the burden of managing Prometheus infrastructure while ensuring compliance with enterprise security and governance policies.
One key difference between Azure’s managed Prometheus and the open-source version is case insensitivity, which may impact existing users who rely on case-sensitive metric naming. Organizations using custom dashboards or alerts that depend on case-sensitive labels should evaluate compatibility before migrating.
Pros:
✅ Fully managed — no need to operate and scale Prometheus manually.
✅ Deep integration with Azure services (e.g., Azure Monitor, AKS).
✅ Automatic updates, high availability, and up to 18 months of data retention.
Cons:
❌ Case insensitivity may cause issues for teams relying on case-sensitive metrics.
❌ Costs may be higher than self-hosted Prometheus in certain use cases.
Azure Managed Grafana
Azure Managed Grafana is a fully managed visualization and analytics service based on the open-source Grafana project. It enables teams to create real-time dashboards and alerts using data sources like Azure Monitor, Azure Managed Prometheus, and self-hosted Prometheus instances. The service provides pre-configured dashboards for common Azure workloads, reducing the setup time for monitoring AKS, virtual machines, and application services.
Since Azure Managed Grafana is a fully managed service, it eliminates the operational burden of managing a self-hosted Grafana instance. However, customization options may be more restricted compared to self-hosted Grafana, particularly for organizations needing extensive plugin support, authentication mechanisms, or fine-grained access control.
Pros:
✅ Fully managed, reducing operational complexity.
✅ Pre-built dashboards and Azure-native integrations for quick insights.
✅ Supports both Azure-managed and self-hosted Prometheus backends.
Cons:
❌ Limited customization and plugin support compared to self-hosted Grafana.
❌ Costs may add up for large-scale usage compared to a self-hosted solution.
We start with creation of the Azure Monitor resource.
az resource create \
    --resource-group aks-blog-rg \
    --namespace microsoft.monitor \
    --resource-type accounts \
    --name AKS-blog-monitor \
    --location swedencentral \
    --properties '{}'
Next step is the creation of the Grafana instance and putting the Azure Monitor and Azure Managed Grafana id’s in variables.
az grafana create \
   --name AKS-blog-Grafana \
   --resource-group aks-blog-rg

grafanaId=$(az grafana show \
               --name AKS-blog-Grafana \
               --resource-group aks-blog-rg \
               --query id \
               --output tsv)

azuremonitorId=$(az resource show \
                    --resource-group aks-blog-rg \
                    --name AKS-blog-monitor \
                    --resource-type "Microsoft.Monitor/accounts" \
                    --query id \
                    --output tsv)
Now that we are going to use the resource id’s that we have put in variables to link the Azure Monitor and Azure Managed Grafana to the Azure Kubernetes Cluster.
az aks update \
   --name aks-blog-cluster \
   --resource-group aks-blog-rg\
   --enable-azure-monitor-metrics \
   --azure-monitor-workspace-resource-id $azuremonitorId \
   --grafana-resource-id $grafanaId
After this step, we check if the monitor pod’s are running.
kubectl get pods -o wide -n kube-system | grep ama-
The output should look something like this

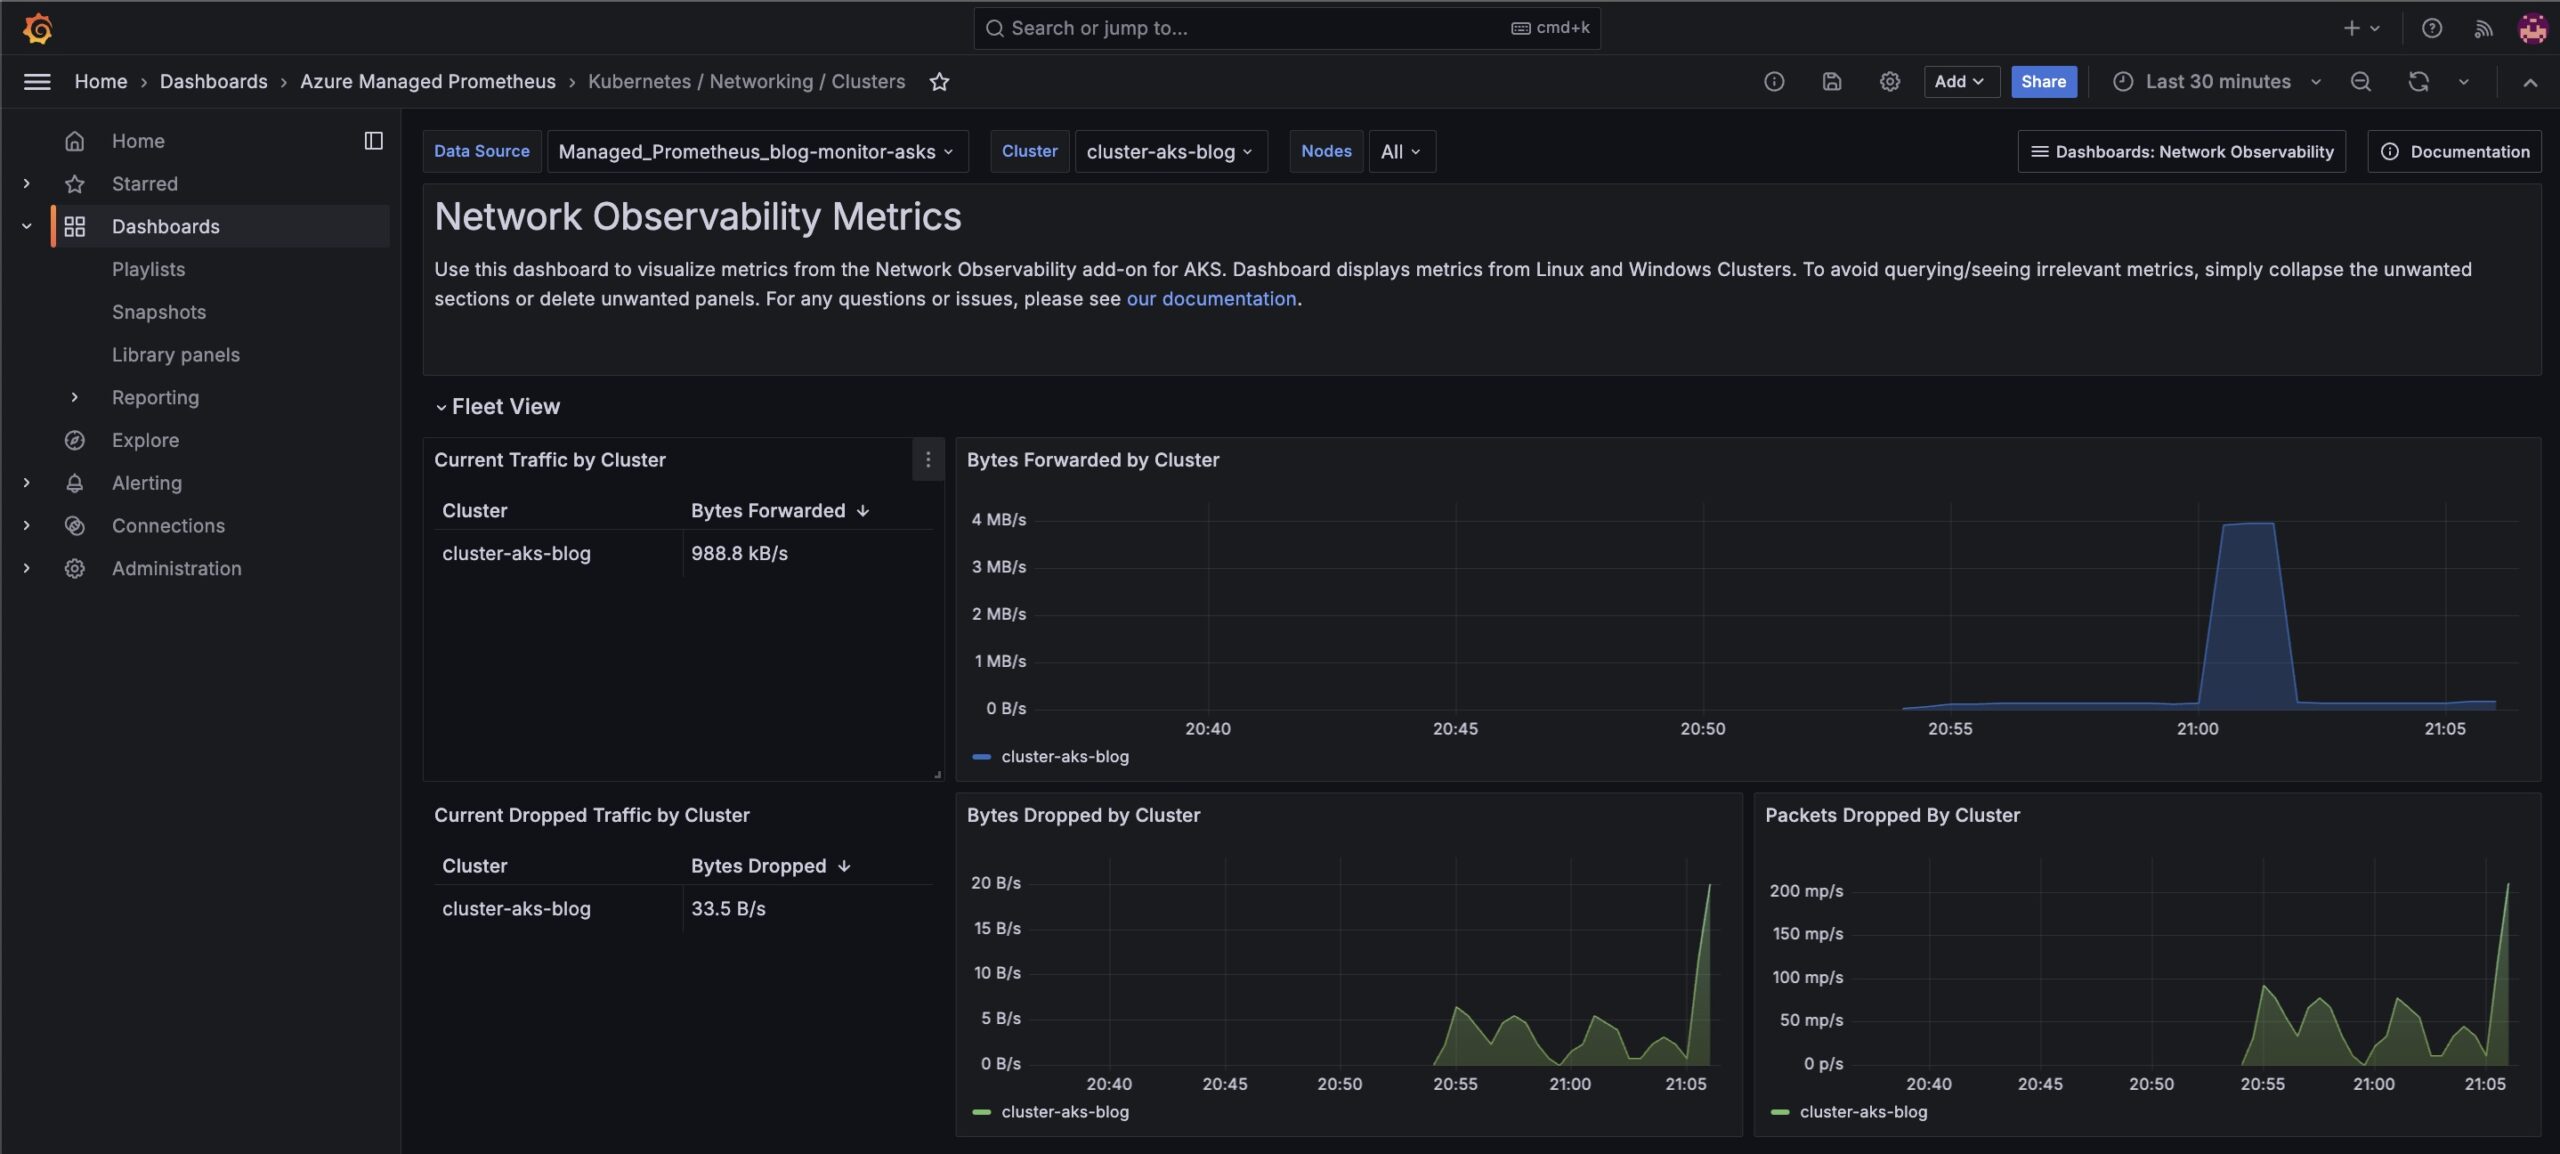
Microsoft has provided sample dashboards as part of the Advanced Container Networking Services to get you started. To open the dashboards go to the portal and search for Managed Grafana. Open the link to Grafana. Go to Dashboards and select the folder Azure Managed Prometheus. There you can find the dashboards

What is Cilium Hubble?
Cilium Hubble is an observability platform built on top of Cilium, an open-source networking and security project powered by eBPF. Hubble extends Cilium’s capabilities by providing real-time monitoring, security visibility, and troubleshooting insights for Kubernetes workloads.
At its core, Hubble enables fine-grained, service-level visibility into network traffic, DNS queries, and application-layer interactions. It provides a UI and CLI to visualize network flows, security policies, and performance metrics, making it a crucial tool for modern cloud-native environments.
Key Features of Cilium Hubble
- Deep Network Observability: Provides detailed insights into L3-L7 traffic, including HTTP, gRPC, and Kafka protocols.
- eBPF-Powered Efficiency: Uses eBPF to collect telemetry data with minimal performance overhead.
- Flow Visibility & Service Dependency Graphs: Visualizes network traffic between Kubernetes pods, namespaces, and services.
- Security Policy Audit & Enforcement: Helps validate network security policies and troubleshoot enforcement issues.
- Distributed Tracing: Supports integrations with Jaeger and OpenTelemetry to provide distributed tracing capabilities.
- CLI and UI Dashboards: Allows engineers to explore network flows, filter logs, and analyze data in real time.
Pros of Using Cilium Hubble
✅ Kubernetes-Native: Designed specifically for Kubernetes environments, making it an ideal fit for cloud-native applications.
✅ Lightweight & High Performance: eBPF ensures efficient data collection without introducing significant latency.
✅ Enhanced Security Visibility: Helps identify policy violations, unauthorized access attempts, and suspicious traffic patterns.
✅ Comprehensive Observability: Offers deep insights into network behavior, security posture, and application interactions.
✅ Seamless Integrations: Works well with Prometheus, Grafana, OpenTelemetry, and security tools like Falco.
Cons of Using Cilium Hubble
❌ Learning Curve: Requires familiarity with Cilium, eBPF, and Kubernetes networking concepts.
❌ Operational Complexity: Managing and configuring Hubble at scale may require additional expertise.
❌ Resource Overhead: While efficient, eBPF-based monitoring can still introduce some resource consumption.
❌ Limited Outside Kubernetes: Primarily designed for Kubernetes environments, making it less useful for non-containerized workloads.
In the script that we used to deploy the Kubernetes clusters we have chosen Cilium for the dataplane and the network policies. Hubble is installed as part of the Cilium installation.
To visualize the Hubble flow we can use the Hubble Cli or we can use Hubble UI.
Visualize using the Hubble Cli
First step is installing the Hubble Cli.
# Set environment variables
export HUBBLE_VERSION=v1.16.3
export HUBBLE_ARCH=amd64
#Install Hubble CLI
if [ "$(uname -m)" = "aarch64" ]; then HUBBLE_ARCH=arm64; fi
curl -L - fail - remote-name-all https://github.com/cilium/hubble/releases/download/$HUBBLE_VERSION/hubble-linux-${HUBBLE_ARCH}.tar.gz{,.sha256sum}
sha256sum - check hubble-linux-${HUBBLE_ARCH}.tar.gz.sha256sum
sudo tar xzvfC hubble-linux-${HUBBLE_ARCH}.tar.gz /usr/local/bin
rm hubble-linux-${HUBBLE_ARCH}.tar.gz{,.sha256sum}
<p/re>
Next step is checking if the Hubble pods are running.
kubectl get pods -o wide -n kube-system -l k8s-app=hubble-relay
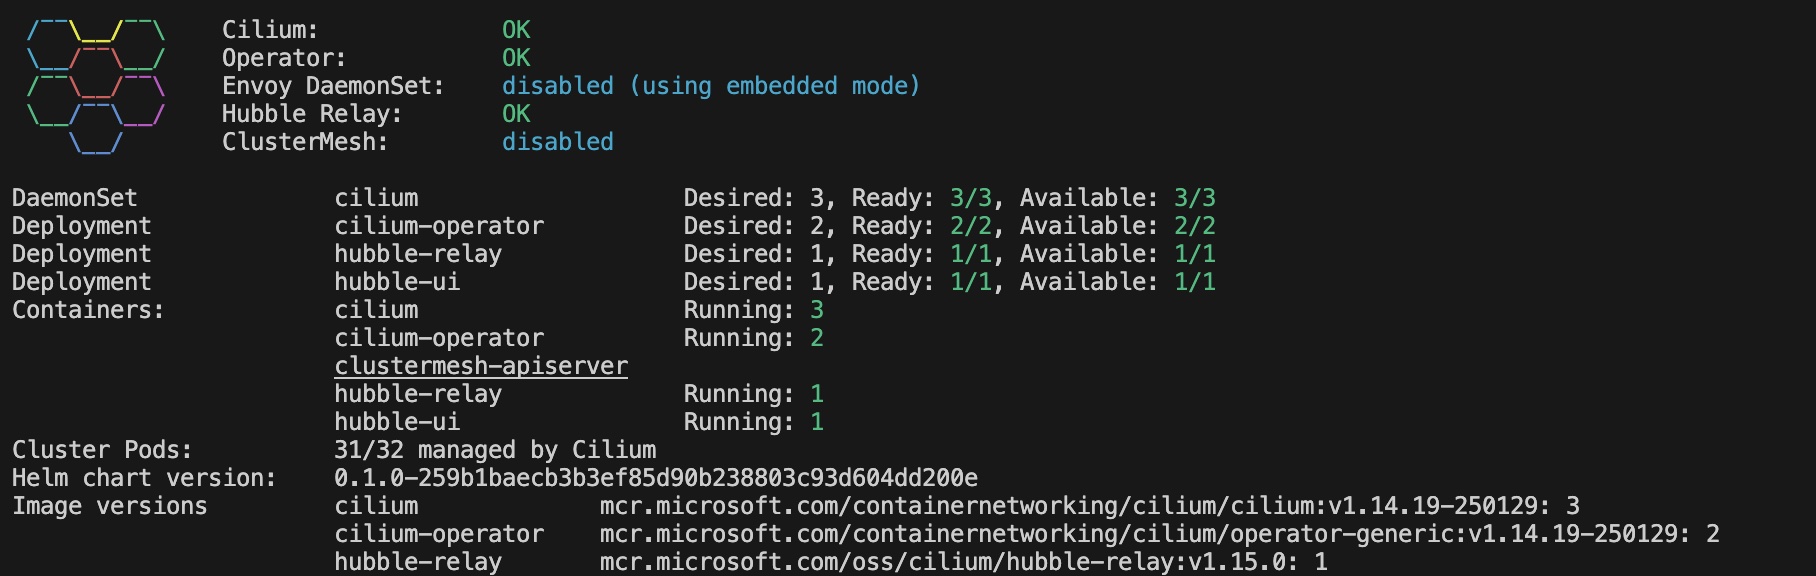
or
Cilium status

To connect the Hubble Cli to the Hubble Relay, we have to forward the port
kubectl port-forward -n kube-system svc/hubble-relay --address 127.0.0.1 4245:443
Securing communications between the Hubble Relay server and its clients is critical. By leveraging Mutual TLS (mTLS), both the server and client authenticate each other using digital certificates, establishing a robust and trusted connection. To enable the Hubble client to retrieve flow data, you must first obtain the necessary certificates and then configure the client to use them. The certificates can be applied with the following commands:
#!/usr/bin/env bash

set -euo pipefail
set -x

# Directory where certificates will be stored
CERT_DIR="$(pwd)/.certs"
mkdir -p "$CERT_DIR"

declare -A CERT_FILES=(
  ["tls.crt"]="tls-client-cert-file"
  ["tls.key"]="tls-client-key-file"
  ["ca.crt"]="tls-ca-cert-files"
)

for FILE in "${!CERT_FILES[@]}"; do
  KEY="${CERT_FILES[$FILE]}"
  JSONPATH="{.data['${FILE//./\\.}']}"

# Retrieve the secret and decode it
  kubectl get secret hubble-relay-client-certs -n kube-system -o jsonpath="${JSONPATH}" | base64 -d > "$CERT_DIR/$FILE"

# Set the appropriate hubble CLI config
  hubble config set "$KEY" "$CERT_DIR/$FILE"
done

hubble config set tls true
hubble config set tls-server-name instance.hubble-relay.cilium.io
After the running the script we have to check if the secrets were generated.
kubectl get secrets -n kube-system | grep hubble-

The hubble observe command supports various parameters that help refine and filter flow data for better analysis. Key parameters include ‘— namespace’ to limit results to a specific Kubernetes namespace, ‘— pod’ to filter flows for a particular pod, and ‘— service’ to track traffic related to a specific Kubernetes service. You can also use ‘— src’ and ‘— dst’ to filter based on source or destination IPs, CIDRs, or Kubernetes identities. For protocol-based filtering, the ‘— protocol’ flag allows you to isolate traffic for TCP, UDP, or ICMP flows. Additionally, the ‘— port’ option focuses on traffic using a specific port, which is useful for debugging application-layer issues.
For deeper insights, the — type parameter helps categorize flows into allowed (L3_L4), dropped (DROP), or error-related (L7) events. The ‘— json’ flag outputs raw JSON for advanced parsing, while ’ — since’ and ‘— until’ allow querying historical flow data within a specific time range. The ‘ — follow’ option streams live flow events in real time, making it useful for active debugging. These parameters make hubble observe a flexible and powerful tool for monitoring network activity, troubleshooting connectivity issues, and enforcing security policies in Kubernetes environments.
Visualizing using the Hubble UI
The Hubble UI provides a graphical interface for visualizing network traffic within a Kubernetes cluster, offering a more intuitive alternative to command-line monitoring. It presents real-time flow data with interactive graphs that display service-to-service communication, network policies, and packet flow details. Users can filter flows based on namespaces, pods, services, or specific endpoints, making it easier to analyze traffic patterns and troubleshoot connectivity issues. The UI also categorizes flows into allowed, dropped, and forwarded events, helping teams quickly identify misconfigurations or security policy violations.
Before we install the Hubble UI, we start with the deployment of an application.
For that we use Stan’s Robot Shop, by IBM, a sample microservices application designed for demonstrating observability and monitoring capabilities. It includes multiple services such as web, payment, and database services. For more information about the application, check out this link.
Stan’s Robot Shop offers a Helm chart for streamlined deployment. Follow these steps to deploy the application.
#Clone the repository
  git clone https://github.com/instana/robot-shop.git
  cd robot-shop/K8s/helm
Create the namespace to deploy the application in.
kubectl create namespace robot-shop
The Helm Chart will be used to will deploy all the necessary services and components of Stan’s Robot Shop into the AKS cluster.
helm install robot-shop --namespace robot-shop
Next step is enabling the Hubble-UI. For that we have to save the following text in hubble-ui.yaml
apiVersion: v1
kind: ServiceAccount
metadata:
  name: hubble-ui
  namespace: kube-system
---
kind: ClusterRole
apiVersion: rbac.authorization.k8s.io/v1
  metadata:
  name: hubble-ui
labels:
  app.kubernetes.io/part-of: retina
rules:
  - apiGroups:
      - networking.k8s.io
    resources:
      - networkpolicies
   verbs:
      - get
      - list
      - watch
   - apiGroups:
      - ""
     resources:
      - componentstatuses
      - endpoints
      - namespaces
      - nodes
      - pods
      - services
    verbs:
    - get
    - list
    - watch
  - apiGroups:
    - apiextensions.k8s.io
  resources:
    - customresourcedefinitions
  verbs:
    - get
    - list
    - watch
    - apiGroups:
    - cilium.io
  resources:
    - "*"
  verbs:
    - get
    - list
     - watch
---
apiVersion: rbac.authorization.k8s.io/v1
kind: ClusterRoleBinding
metadata:
  name: hubble-ui
  labels:
    app.kubernetes.io/part-of: retina
  roleRef:
    apiGroup: rbac.authorization.k8s.io
    kind: ClusterRole
    name: hubble-ui
  subjects:
    - kind: ServiceAccount
    name: hubble-ui
    namespace: kube-system
---
apiVersion: v1
kind: ConfigMap
  metadata:
  name: hubble-ui-nginx
  namespace: kube-system
data:
  nginx.conf: |
    server {
        listen 8081;
        server_name localhost;
        root /app;
        index index.html;
        client_max_body_size 1G;
        location / {
            proxy_set_header Host $host;
            proxy_set_header X-Real-IP $remote_addr;
            # CORS
            add_header Access-Control-Allow-Methods "GET, POST, PUT, HEAD, DELETE, OPTIONS";
            add_header Access-Control-Allow-Origin *;
            add_header Access-Control-Max-Age 1728000;
            add_header Access-Control-Expose-Headers content-length,grpc-status,grpc-message;
            add_header Access-Control-Allow-Headers range,keep-alive,user-agent,cache-control,content-type,content-transfer-encoding,x-accept-content-transfer-encoding,x-accept-response-streaming,x-user-agent,x-grpc-web,grpc-timeout;
            if ($request_method = OPTIONS) {
                return 204;
            }
            # /CORS
            location /api {
                proxy_http_version 1.1;
                proxy_pass_request_headers on;
                proxy_hide_header Access-Control-Allow-Origin;
               proxy_pass http://127.0.0.1:8090;
           }
           location / {
               try_files $uri $uri/ /index.html /index.html;
           }
           # Liveness probe
           location /healthz {
               access_log off;
               add_header Content-Type text/plain;
               return 200 'ok';
           }
        }
     }
---
kind: Deployment
apiVersion: apps/v1
metadata:
  name: hubble-ui
  namespace: kube-system
  labels:
    k8s-app: hubble-ui
    app.kubernetes.io/name: hubble-ui
    app.kubernetes.io/part-of: retina
  spec:
    replicas: 1
    selector:
      matchLabels:
        k8s-app: hubble-ui
    template:
      metadata:
        labels:
          k8s-app: hubble-ui
          app.kubernetes.io/name: hubble-ui
          app.kubernetes.io/part-of: retina
      spec:
        serviceAccountName: hubble-ui
        automountServiceAccountToken: true
        containers:
        - name: frontend
          image: mcr.microsoft.com/oss/cilium/hubble-ui:v0.12.2
          imagePullPolicy: Always
          ports:
          - name: http
            containerPort: 8081
         livenessProbe:
           httpGet:
             path: /healthz
             port: 8081
         readinessProbe:
           httpGet:
             path: /
             port: 8081
         resources: {}
         volumeMounts:
         - name: hubble-ui-nginx-conf
           mountPath: /etc/nginx/conf.d/default.conf
           subPath: nginx.conf
         - name: tmp-dir
           mountPath: /tmp
         terminationMessagePolicy: FallbackToLogsOnError
         securityContext: {}
       - name: backend
         image: mcr.microsoft.com/oss/cilium/hubble-ui-backend:v0.12.2
         imagePullPolicy: Always
         env:
         - name: EVENTS_SERVER_PORT
           value: "8090"
         - name: FLOWS_API_ADDR
           value: "hubble-relay:443"
         - name: TLS_TO_RELAY_ENABLED
           value: "true"
         - name: TLS_RELAY_SERVER_NAME
           value: ui.hubble-relay.cilium.io
         - name: TLS_RELAY_CA_CERT_FILES
           value: /var/lib/hubble-ui/certs/hubble-relay-ca.crt
         - name: TLS_RELAY_CLIENT_CERT_FILE
           value: /var/lib/hubble-ui/certs/client.crt
         - name: TLS_RELAY_CLIENT_KEY_FILE
           value: /var/lib/hubble-ui/certs/client.key
        livenessProbe:
          httpGet:
            path: /healthz
            port: 8090
        readinessProbe:
          httpGet:
            path: /healthz
            port: 8090
        ports:
        - name: grpc
          containerPort: 8090
       resources: {}
       volumeMounts:
        - name: hubble-ui-client-certs
          mountPath: /var/lib/hubble-ui/certs
          readOnly: true
        terminationMessagePolicy: FallbackToLogsOnError
        securityContext: {}
      nodeSelector:
        kubernetes.io/os: linux
      volumes:
      - configMap:
           defaultMode: 420
           name: hubble-ui-nginx
        name: hubble-ui-nginx-conf
      - emptyDir: {}
        name: tmp-dir
      - name: hubble-ui-client-certs
        projected:
         defaultMode: 0400
         sources:
         - secret:
             name: hubble-relay-client-certs
             items:
               - key: tls.crt
                 path: client.crt
               - key: tls.key
                 path: client.key
               - key: ca.crt
                 path: hubble-relay-ca.crt
---
kind: Service
apiVersion: v1
metadata:
  name: hubble-ui
  namespace: kube-system
  labels:
    k8s-app: hubble-ui
    app.kubernetes.io/name: hubble-ui
    app.kubernetes.io/part-of: retina
spec:
  type: ClusterIP
  selector:
    k8s-app: hubble-ui
  ports:
    - name: http
      port: 80
      targetPort: 8081
After we have saved the file, we can apply the yaml using kubectl
kubectl apply -f hubble-ui.yaml
To make the Hubble UI reachable we forward the port
kubectl -n kube-system port-forward svc/hubble-ui 12000:80
We can now open the Hubble UI using the browser and connect to http://localhost:/12000/ . The Hubble UI presents all the available namespaces in the cluster. We select the robot-shop namespace to see traffic between the different parts off the application.

It is possible to filter the traffic on all, forwarded or dropped traffic.
Conclusion
In closing, observability isn’t just another buzzword — it’s a critical part of managing modern cloud infrastructure. By using tools like eBPF, Cilium Hubble, and Azure’s managed Prometheus and Grafana services, you get real, actionable insights into your AKS clusters. This isn’t just about spotting issues after they happen; it’s about building a proactive approach that lets you diagnose problems, optimize performance, and secure your environment before challenges escalate.
What we’ve explored here shows that while these tools add incredible power to your operations, they also demand a good balance of technical know-how and thoughtful planning. I encourage you to dive in, experiment with these solutions, and adapt them to fit your specific needs.
Thanks for reading. I encourage you to experiment with these tools and share your experiences and I look forward to sharing more on this journey as we continue exploring the ever-evolving world of Azure Kubernetes. Stay tuned for the next episode of Azure Kubernetes Chronicles!
Want to know more about what we do?
We are your dedicated partner. Reach out to us.